Dashboards can be created mutiple ways, following is possible:
-Default dashboards (which can also be a Service Level Dashboard or Summary Dashboard)
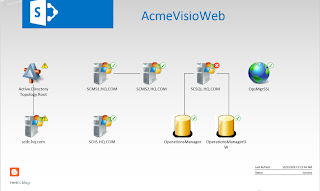
-Microsoft Visio dashboards (which is published in SharePoint)
-Savision Live Maps (many possibilities, but additional licenses needed)
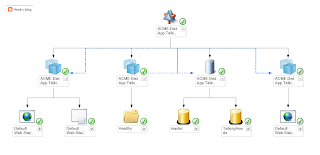
-Distributed Applications (chain monitoring of .NET applications)
Default dashboards are created with a layout and widgets. Widgets are powerful objects which can be used many ways. First decide how to build the framework, you can choose between:
-Column Layout (enables up to 5 vertical columns to displayed in a row)
-Grid Layout (allows layouts of 1, 2, 3, 4, 5, 6 or 9 cells)
-Service Level Dashboard (shows the data for a pre-configured SLA)
-Summary Dashboard (adds 3 default widgets in a 3-cell configuration)
Widgets can be choosen from the following list:
-Objects by Performance Widget (sort of Top 10 dashboard)
-Object SLA Widget (group that has an SLA applied to it)
-Performance Widget (creates a performance graph)
-State Widget (can be based on multiple configurations)
-SLA Widget (shows the data for a pre-configured SLA)
-SLA Configuration (Service Level tracking)
-Alert Widget (allows the display of alerts)
-Details Widget (shows the details of selected alerts)
-Instance Details Widget (show details of a selected group or instance)
-SLA Configuration Note (monitor Service Level Objectives)
Microsoft Visio dashboards are created with SharePoint 2010 using Microsoft Visio 2010 and SharePoint 2010 Extensions for System Center 2012. Just make sure you have SharePoint 2010 Enterprise edition installed, because only this edition has the Visio Web Service available. Within Visio a dashboard can be created and used in SharePoint with Extensions. That way a graphical dasboard can be created with OpsMgr Health Explorer access on all items. Have a look here for installation: http://blog.scomfaq.ch/2013/07/10/scom-2012-sp1-publish-visio-dashboard-in-sharepoint-2010-walkthrough/
Live Maps for System Center is the enterprise visualization solution for Microsoft System Center. Their interactive dashboards, maps and diagrams add business context to every alert and incident, making sure your limited resources can focus on the things that really matter to your business. Live Maps is ready for R2! The upcoming release of Live Maps is compatible with System Center 2012 R2, Windows Server 2012 R2 and Windows 8.1. The release will be available on October 18. No SharePoint 2010 or Visio 2010 are needed with Live Maps. Just install the product and get started. All objects in OpsMgr will be automatically available for dashboard creation.
A Distributed Application in OpsMgr is an application that is comprised of multiple objects. These objects may be defined by different management packs and may be managed on the same agent or on different agents. The purpose of the distributed application is to provide an overall health for an application that is comprised of different objects. Distributed applications do not provide any additional monitoring for the objects in an application. Instead, they include objects that are already being monitored. The value of the distributed application is to provide a relationship between the health of objects that are part of a single application. You can create distributed applications using the Distributed Applications Designer in the Operations console.
A few examples on this:
 |
| Summary Dashboard in SharePoint 2010 |
 |
| A Distributed .NET Application |
 |
| MAP View with Active Locations |
 |
| Integration with Microsoft Visio |
 |
| Performance Widget - Grid Layout |
 |
| Service Level Dashboard |
 |
| Network Monitoring |
 |
| SLA Widget - Grid Layout |
Want to know more? Just leave a comment on this post.

No comments:
Post a Comment