Showing posts with label OpsMgr. Show all posts

Thursday, November 19, 2015

OpsMgr warning: Power Shell script was dropped (solved)

Recently I did some OpsMgr troubleshooting. This in an environment with lot of agents and management packs installed. On multiple Hyper-V hosts there is a recurring OpsMgr warning seen: Power Shell script was dropped. I did a lot to try solve the issue, but despite the activities, it didn't do the job. Hope to found a solution on this, so therefore this blogpost.
 
Let's have a look at Product Knowledge first:
 
Summary
The System Center Management Health Service could not run a PowerShell script as part of a rule or monitor due to over utilization.

This may affect some monitoring or discovery.
 
Causes
This can be caused by:
-Too many PowerShell scripts being run by the System Center Management Health Service.
-PowerShell scripts are taking too long to execute.
-PowerShell scripts are running too frequently.
-The computer does not have enough resources (for example; memory) to run the PowerShell script.

 
Resolutions
The alert description and context has information indicating which rule or monitor failed. However, there may be other rules or monitors failing as well. The following link will display all events indicating a failure to run the executable:

After reviewing the error in the context, consider reducing the frequency of the PowerShell script.
Ensure that the computer is not over utilized.
-Check Task Manager to see if there is enough free memory.
-Check Task Manager to see if there are any processes consuming all the CPU.

This can also be caused when too many PowerShell scripts are being scheduled. This could be the result of an event storm or a misconfigured timer. In both cases the rule configuration will have to be examined to determine why the PowerShell script is running too often and usually will need to be backed down somehow (increasing the interval).


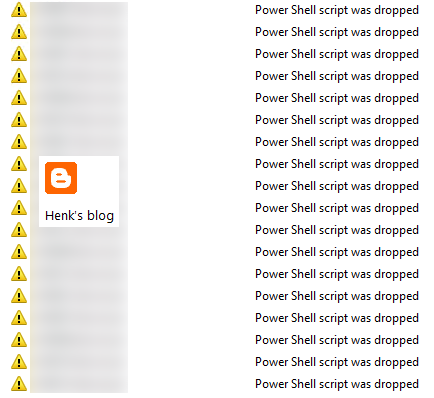
Let's have a look at Event Viewer now:
 
Workflow names (there are more):
Microsoft.SystemCenter.VirtualMachineManager.Network.2012.Vport.BytesReceivedPerSec
Microsoft.SystemCenter.VirtualMachineManager.Network.2012.Vport.BytesSentPerSec

Microsoft.Windows.Server.2012.MaxConcurrentAPI.Monitor
Microsoft.Windows.HyperV.2012.R2.DiskPartitionSpaceProvider.FreeSpaceCollectionRule
Microsoft.Windows.HyperV.2012.R2.DiskPartitionSpaceProvider.UsedSpacePercCollectionRule
Veeam.Virt.Extensions.HyperV.VM.Monitor.Heartbeat

Veeam.Virt.Extensions.HyperV.VM.ClusterResourceGroupStatus.Monitor
Veeam.Virt.Extensions.HyperV.VMRule.DISK.usedStorage.ByInstance
Veeam.Virt.Extensions.HyperV.VMRule.DISK.usedStorage

 
Script names (there are more):
CheckMaxConcurrentAPI.ps1, ClusterVMState.ps1
GetDiskPartitionSpaceV2.ps1, GetVPortPerfData (a lot)

SummaryInfo.ps1, UsedStorageV3.ps1
 
All errors seen here has Event ID 22411 and Source Health Service Modules. They will be generated every 30 minutes again.

Easy solution could be to stop rule alerts, so that no warnings on Dropped Power Shell script would be displayed anymore. But that doesn't take away the thousand of errors on any Hyper-V host seen. I did look at the following websites for more information too. Hope anyone can point me in the right direction on this. Thanks!
 
Websites visited:
ReSearch This KB – Power Shell script was dropped
What does powershell script 'GetVPortPerfData' do in SCOM?
Powershell Script to "Disable/Enable" Subscriptions
OpsMgr 2012 Self Maintenance Management Pack Update
SCOM: powershell run space failed to start

Update: Based on the website from Reidar Johansen I followed the steps to disable both Virtual Port errors. After that no new events were logged on Hyper-V anymore and no new warnings were created in OpsMgr. Start the command: Get-SCOMRule -Name Microsoft.SystemCenter.VirtualMachineManager.Network.2012.Vport.* and disable the rules DisplayName: [Virtual port received bytes per second] and [Virtual port sent Bytes per second] and you will be fine. Hope it helps!

Wednesday, November 18, 2015

The management pack cannot be downloaded and the temporary file has been deleted

When using Operations Manager (OpsMgr/SCOM) and want to see if there are updates on management packs, just check Download management packs > Add > Updates available for installed management packs. On a few management packs however the following error message was displayed:
<MP> did not pass the security verification. The management pack cannot be downloaded and the temporary file has been deleted. A few management packs I get this error are Hyper-V, Lync/Exchange and SQL server, but I guess there may be more.

The following must be done when having this error: Apparently Microsoft released a newer version, which can be downloaded straight from Microsoft, but not from within OpsMgr. After downloading and importing it no error message is displayed anymore. Too bad a few management packs cannot be downloaded right away at this moment, by probably Microsoft will fix it in future.

Source: https://social.technet.microsoft.com/forums/systemcenter/en-US/e97ba10e-563f-4d8c-bccd-799c0ceb4227/system-center-core-monitoring-reports-mp-verification-failed (old post from 2010 but still active)

Hope it helps!

Monday, November 16, 2015

Savision Live Maps Unity for System Center Operations Manager

SCOM alerts
Let's have a look at a common situation you find many times at customer sites: when using Microsoft System Center Operations Manager (SCOM), you know that alerts can be overwhelming. When multiple management packs are imported for more functionality and many agents are enrolled on servers with different applications and roles installed on them, you must configure Operations Manager to benefit from it! Otherwise there can be so many SCOM alerts and e-mail messages a day, that monitoring isn't effective anymore. I did see black television screens (monitoring screens turned off) and IT admins deleting all alerts each day (doing monitoring from that point), often. You can find an in-depth article about SCOM alert storms here.

On the other hand, no graphical Service dashboard is available for a perfect monitoring overview by design. The default built-in SCOM dashboards are using a column or grid layout, with performance, state, alert, and details widgets. They’re good for a basic overview, but nothing more than that. Dashboards can be created in Microsoft Visio, as well as you may know. By using SharePoint Extensions for System Center 2012, they can be connected with the Operations Manager environment. The problem is you need to create those dashboards yourself and have SharePoint Enterprise edition installed. It’s not so easy and user-friendly to create dashboards that way.

Let's introduce Savision Live Maps Unity here. With 700 organizations worldwide using Live Maps Unity, it's the business service management solution you want!


Savision’s SCOM dashboards
With Live Maps Unity, which is used for both monitoring service health and performance, this perfect monitoring overview (as mentioned before) is available! It can be used for a graphical Service dashboard instead, but it's much more than that. Savision's Live Maps Unity speaks the language of the business by focusing on service delivery. It includes unlimited HTML5-based SCOM dashboards for monitoring both service health and performance. With Savision’s SCOM dashboards (based on HTML5-code, which is fast and lightweight), there is no need to look at alerts all day. Just focus on the information Live Maps Unity sends to you.

There won't be many e-mail messages anymore as well. This because Live Maps Unity notifies only when necessary, giving IT admins the time needed to research and solve issues instead of wasting time on notifications. With the Service dashboard in-place, IT admins can use Operations Manager proactive again instead of reactively. The Service dashboard gives you all information needed on a single screen. It’s generated automatically, based on applications found in your environment and gives a total overview of business-critical services, like Exchange, SharePoint, Active Directory and more.

No need to design all those dashboards yourself. Live Maps Unity has the capability to examine your entire IT infrastructure. Additional dashboards can be created with a few clicks by using the built-in drag-and-drop interface. This is really different than using Microsoft Visio, mentioned before. This data is connected with real components and applications by default. These dashboards can be shown from anywhere on any device! This can be done on a mobile device (tablet or smartphone) or desktop if you prefer. This isn’t possible with the default SCOM solution; you have to use another solution for this.

Business Service Management Solution
With Live Maps Unity, you have that solution. The product can be used to monitor entire IT infrastructures, with features like: performance monitoring, .NET application discovery, easy-to-build dashboards, and a Services dashboard. It offers a lightweight web console with support for all major browsers; so no need to have a physical console installed. It offers interactive geographical maps and native System Center integration. It allows quick visualizations of the IT environment through SCOM dashboards. It has everything inside for monitoring service health and performance. It’s the Business Service Management Solution that makes SCOM the perfect monitoring solution!

As a result: With SCOM and Savision’s Live Maps Unity, you have best of both worlds and true power in SCOM finally. No need to focus on alerts anymore, because it helps to deal with the root cause of notifications. Just focus on alerts which really need your time and attention to manage the healthiest environment possible.

Included are some web links to find more information on the product and even more functionality as well. There are some videos and datasheets available too.

Happy monitoringJ!
(Sponsor post)

Monday, April 20, 2015

Current and upcoming features you’ll love in monitoring with Microsoft

Sponsor post

Join our exclusive webinar with MVPs Cameron Fuller and Bob Cornelissen (Jalasoft)

Operations Manager is continuously evolving! This includes management packs, new ways of looking at monitoring and gaining insight into monitored business services, cloud services, and more.

This webinar explores new developments in the Microsoft monitoring sphere, as well as developments in SCOM and Azure Operational Insights and how to benefit from these options: 
 
  • Hear about changes in the current product to monitor your environment more effectively.
  • Learn tips and tricks to be more effective as an Operations Manager administrator.
  • See possibilities of Operational Insights and how the solutions from the Cloud can augment your monitoring.
  • Explore the futures of SCOM and monitoring solutions from Microsoft.

Join us this Thursday, April 23rd, 2015 at 12:00 EDT / 11:00 CDT / 18:00 CEST.

Tuesday, October 14, 2014

New features are coming on Live Maps, Cloud Reporter and Cloud Advisor

Sponsor post

I have become familiar with Savision because of Live Maps. Live Maps Unity is a great Business Service Management solution that monitors service health performance and with it you can create dynamic and graphical dashboards easily. This is done in combination with OpsMgr, which I implement for different customers.
Within Live Maps you can create dashboards with drag-and-drop functionality at once. It's like Microsoft Visio, but then using different build-in templates and live objects!
Caption from Live Maps Unity

End of this month, during MS TechEd in Barcelona, Savision will bring new releases and updates on Live Maps, but also on Cloud Reporter and Cloud Advisor. Let's have a look at the changes:
-Live Maps Unity, will have new features such as Performance Data, Out-of-box Services and .Net Application Discovery. Savision have been working very hard during this year to move away from being just an OpsMgr add-on, and only dashboards and maps, so with their Live Maps Unity release, they have become instead a Business Service Management solution.
-Cloud Reporter is a robust capacity planning solution for private clouds based on Microsoft’s Hyper-V and VMware vSphere, which will have the same wisdom and analysis to VMware that is offered for Hyper-V.
-Cloud Advisor integrates natively into the Virtual Machine Manager and vSphere console, analyzes your Hyper-V or VMware environment for problems, and then provides specific and detailed recommendations to tune VM's and hosts for better performance and availability.

To give you a glimpse of upcoming features in Live Maps Unity, have a look at these posts already:
-Performance Data
-Out-of-Box Services
-Dynamically Updating Services

Within the posts you can see that the following features are coming:
-Performance information with HTML5 support for performance data
-Out-of-the-box templates for Microsoft Exchange, Microsoft Active Directory and Microsoft SharePoint (which looks great to me!)
-Cloud Reporter and Cloud Advisor can be used for both Microsoft’s Hyper-V as VMware vSphere in the next release.

Update: There are multiple webinars to come for new Q4 2014 Releases. Don't miss them!

-Live Maps Unity Webinar by Dennis Rietvink, co-founder and VP of Product Management of Savision
US: Monday, November 10, 2014 11:00 am EDT/ 17:00 pm CEST
EU: Tuesday, November 11, 2014 9:00 am EDT/ 15:30 pm CEST


-Cloud Reporter & Cloud Advisor Webinar by Steven Dwyer, VP of R&D of Savision
US: Tuesday, November 18, 2014 11:00 am EDT/ 17:00 pm CEST
EU: Thursday, November 20, 2014 9:30 am EDT/ 15:30 pm CEST

Monday, July 14, 2014

Event 10102, Health Service Modules, PerfDataSource warnings

On a ConfigMgr server at customer location I did see a lot of Event 10102, Health Service Modules, PerfDataSource warnings. Every 75 minutes, there were a lot of warnings detected, and customer want me to resolve this. Let's have a look.

A warning was looking like this:
In PerfDataSource, could not resolve counter SMS Inbox, File Current Count, swmproc.box>usage. Module will not be unloaded.
One or more workflows were affected by this. 
Workflow name: Microsoft.SystemCenter2012.ConfigurationManager.Perf_Threshold_Site_server_SWM_inbox_backlog_monitor
Instance name: ConfigMgr Primary Site Server - <removed>

Instance ID: {ECB782E3-F42F-23D2-C609-65CC8B78BA48}
Management group: <removed>


Because this message was coming from Operations Manager, and the OpsMgr Action account was configured on local system, I thought it would be a good idea to have a look at local administrator permissions. Long story short, I added both ConfigMgr SYSTEM account and SQL service account to the ConfigMgr server local administrator permissions, and after reboot no warnings were there anymore. In the end it was a security issue after all. Hope it helps!

Wednesday, May 21, 2014

Using the SQL 2012 dashboard within Operations Manager 2012 R2

Within System Center Operations Manager (OpsMgr) 2012 R2 you can use the new great SQL 2012 dashboard. The dashboard can be used for SQL 2012 only however. Let's have a look.
 
The System Center Management Pack for SQL Server can be found here: Download Center. The Management Pack for SQL Server provides the capabilities for Operations Manager 2007 R2 and Operations Manager 2012 to discover and monitor SQL Server 2005, 2008, 2008 R2, 2012 and their components such as SQL instances, databases, and SQL Server agents.
 
When installing the Management pack from the online catalog, you will not found the SQL 2012 dashboard at all. That's why you need to download it from Download Center. The Management packs you need to import are:
-Microsoft SystemCenter Visualization Component Extensions Library
-Microsoft SQLServer Presentation
 
After this you will find the SQL 2012 dashboard in the Microsoft SQL server, Databases, SQL Server 2012 Databases Summary Dashboard. Remember that only SQL 2012 databases will be showed in the dashboard. One of the new features is the widget that will show the related health state color. With that you have a quick overview of the selected SQL 2012 database.

 
After installation I did not see any health state at all however. That's because the monitors, which are needed for that, are disabled by default. To override these monitors go to Authoring Pane, Management Pack, Monitors. Now paste the monitor “Transaction Log Free Space” into the search bar and select the monitor in the "SQL 2012 DB management pack". You can now enable this monitor when right click and select override “For all object of the class: SQL 2012 DB” and choose enable with the check box.
 
In the override column change false to true and save this setting in a "Overrides SQL server Management pack". Do this for all changes needed in OpsMgr by default! The following four Monitors which must be enabled for the dashboard are:
-Transaction Log Free Space (%)
-DB Total Space
-Disk Read Latency
-Disk Write Latency


After configuration I still did not see any health state at all. Bummer! That's because security is not in place by default too. When SQL 2012 is installed by default - we no longer place BUILTIN\Administrators in the security access list, AND we restrict NT AUTHORITY\SYSTEM to “public” access. Therefore a RunAs account is needed for communication now. This RunAs account will be granted Local Admin over the OS and SA (SysAdmin) rights to SQL. After that you will see the widget that will show the related health state color.

Just a beautiful dashboard isn't it!?

Sources:
System Center Dynamics by wwwally
Microsoft TechNet Forums
Kevin Holman's System Center Blog

Update: Albert Neef mentions MSDN Blogs to manage SQL 2008 databases within the dashboard as well. Very nice indeed!

Thursday, November 7, 2013

Creating multiple dashboards in OpsMgr 2012 R2

As mentioned before I did a Operations Manager (OpsMgr) 2012 R2 installation already. One of the great items in OpsMgr (for myself) is creating dashboards. In OpsMgr dashboards can be created multiple ways. Some can be created in OpsMgr by default, some can be created with additional software needed. It's not my point to describe how to build them, but to point you in the right direction which is possible. Here we go!

Dashboards can be created mutiple ways, following is possible:
-Default dashboards (which can also be a Service Level Dashboard or Summary Dashboard)
-Microsoft Visio dashboards (which is published in SharePoint)
-Savision Live Maps (many possibilities, but additional licenses needed)
-Distributed Applications (chain monitoring of .NET applications)

Default dashboards are created with a layout and widgets. Widgets are powerful objects which can be used many ways. First decide how to build the framework, you can choose between:

-Column Layout (enables up to 5 vertical columns to displayed in a row)
-Grid Layout (allows layouts of 1, 2, 3, 4, 5, 6 or 9 cells)
-Service Level Dashboard (shows the data for a pre-configured SLA)

-Summary Dashboard (adds 3 default widgets in a 3-cell configuration)

Widgets can be choosen from the following list:
-Objects by Performance Widget (sort of Top 10 dashboard)
-Object SLA Widget (group that has an SLA applied to it)
-Performance Widget (creates a performance graph)
-State Widget (can be based on multiple configurations)
-SLA Widget (shows the data for a pre-configured SLA)
-SLA Configuration (Service Level tracking)
-Alert Widget (allows the display of alerts)
-Details Widget (shows the details of selected alerts)
-Instance Details Widget (show details of a selected group or instance)
-SLA Configuration Note (monitor Service Level Objectives)

Microsoft Visio dashboards are created with SharePoint 2010 using Microsoft Visio 2010 and SharePoint 2010 Extensions for System Center 2012. Just make sure you have SharePoint 2010 Enterprise edition installed, because only this edition has the Visio Web Service available. Within Visio a dashboard can be created and used in SharePoint with Extensions. That way a graphical dasboard can be created with OpsMgr Health Explorer access on all items. Have a look here for installation: http://blog.scomfaq.ch/2013/07/10/scom-2012-sp1-publish-visio-dashboard-in-sharepoint-2010-walkthrough/

Live Maps for System Center is the enterprise visualization solution for Microsoft System Center. Their interactive dashboards, maps and diagrams add business context to every alert and incident, making sure your limited resources can focus on the things that really matter to your business. Live Maps is ready for R2! The upcoming release of Live Maps is compatible with System Center 2012 R2, Windows Server 2012 R2 and Windows 8.1. The release will be available on October 18. No SharePoint 2010 or Visio 2010 are needed with Live Maps. Just install the product and get started. All objects in OpsMgr will be automatically available for dashboard creation.

A Distributed Application in OpsMgr is an application that is comprised of multiple objects. These objects may be defined by different management packs and may be managed on the same agent or on different agents. The purpose of the distributed application is to provide an overall health for an application that is comprised of different objects. Distributed applications do not provide any additional monitoring for the objects in an application. Instead, they include objects that are already being monitored. The value of the distributed application is to provide a relationship between the health of objects that are part of a single application. You can create distributed applications using the Distributed Applications Designer in the Operations console.


A few examples on this:

Summary Dashboard in SharePoint 2010
 
A Distributed .NET Application
 
MAP View with Active Locations
 
Integration with Microsoft Visio
 
Performance Widget - Grid Layout
 
Service Level Dashboard
 
Network Monitoring
 
SLA Widget - Grid Layout
 
They look just great isn't it? Possibilities are many on this point.
Want to know more? Just leave a comment on this post.


Wednesday, October 30, 2013

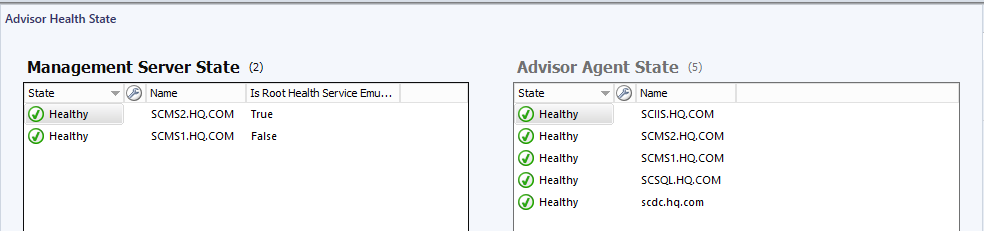
System Center Advisor integration in OpsMgr 2012 R2

Last week I did a Operations Manager (OpsMgr) 2012 R2 installation already. One of the new features in Release 2 (R2) is System Center Advisor integration. OpsMgr now includes Advisor as an Attached Service, which will allow you to add Advisor monitoring to Windows management servers in your SCOM environment. Sounds nice isn't it?


Since March 2013 Advisor is free of charge and without the Software Assurance (SA) coverage requirement. Al you need is a Microsoft or Organizational account to start the integration. Then decide which servers will be monitored by Advisor. In OpsMgr console there will be Advisor alerts from now also. Just great to have this integration!

The following workloads are analyzed:
  • Windows Server 2012 and Microsoft Hyper-V Server 2012
  • Windows Server 2008 and 2008 R2:
    • Active Directory
    • Hyper-V Host
    • General operating system
  • SQL Server 2008 and later
    • SQL Engine
  • Microsoft SharePoint 2010
  • Microsoft Exchange Server 2010
  • Microsoft Lync Server 2010
  • Microsoft Lync Server 2013 (new in October 2013)
  • System Center 2012 SP1 – Virtual Machine Manager (new in August 2013)
  • Source: Welcome to System Center Advisor


Just some information on System Center Advisor (http://www.systemcenteradvisor.com) is an online service that analyzes installations of Microsoft server software. Advisor collects data from your installations, analyzes it, and generates alerts that identify potential issues (such as missing security patches) or deviations from identified best practices with regard to configuration and usage. Advisor also provides both current and historical views of the configuration of servers in your environment.

Tuesday, April 2, 2013

How to find the SQL Server used for OpsMgr installation

When looking in the OpsMgr console, you cannot see which SQL Server is used for the OperationsManager and OperationsManagerDW database. There are however a few ways to find this server. I will explain them in this blogpost.

1) Install the SQL Server management pack and wait till the SQL Servers are discovered. Expand the Databases tree and type 'OperationsManager' into the look for field. Select the database and in path name you will see the server (and instance) hosting the database. (Or look at the databases immediately)

2) You can determine the SQL database by reviewing the following registry key: HKEY_LOCAL_MACHINE\SOFTWARE\Microsoft\Microsoft Operations Manager\3.0\Setup\DatabaseServerName. On this location the server (and instance) hosting the database is found.

3) Go to Monitoring, Discovered Inventory and run the 'Change Target Type' task. Select 'Operations Manager Operational Database Watcher' and choose OK. You will only see one instance.  Scroll to the right until you see the 'Operational Database Server Name' and 'Operational Database Name' columns.

Hope you find this as useful as I did.

Tuesday, October 4, 2011

Error in ConfigMgr after Reporting Services Point installation

In ConfigMgr the default Reporting Point role is installed normally. Then reports will be generated and processed on the ConfigMgr server. There is however the choice to install a Reporting Services Point role on the SQL Server. Then reports will be generated and processed on the SQL Server. Much faster that way, industry standard formatting and the possibility to export reports to many formats!


Just add the Reporting Services Point role to the SQL Server and follow the steps in SQL "Reporting Services Configuration". Create a ReportServer database and virtual directory there. Then go back to the ConfigMgr server and choose "Copy Reports to Reporting Services". Just follow the wizard and specify the SQL Server with Reporting Services installed (and configured!).


After copying reports is done it's possible that an error message is displayed in the ConfigMgr system status. The Message ID displayed is 7403 : SMS SRS web service is not running on SRS Reporting Point server "<SQL server>". Although Reporting Services is running fine and reports can be started it's not quite nicely.


The solution for this is not that hard, but maybe not easy to find. An SQL Server update is needed to resolve this issue. Now the Cumulative Update (CU) package 4 for SQL Server 2008 R2 fix the error 7403. It can be downloaded here: http://support.microsoft.com/kb/2345451/en-us

It's even better to install Service Pack (SP) 1 to include all Cumulative Updates released before. It can be download here: http://www.microsoft.com/download/en/details.aspx?id=26727 

Mandatory need for Reporting Services?
An Reporting Services Point is needed when Power Management (R3) and/or Forefront Endpoint Protection (FEP) integration is used in ConfigMgr. If that's not the case, you can choose between both Reporting solutions!

ConfigMgr and OpsMgr on the same SQL Server?
When multiple Reporting Services instances are needed (for example: ConfigMgr and OpsMgr on the same server), remember to place ConfigMgr in the "default instance". you need to install ConfigMgr first because it wants the default instance where as OpsMgr can bet set to a different one.  So you should be able to have them both use the same server, but not the same instance.

Tuesday, September 27, 2011

How to install OpsMgr 2007 R2 on SQL Server 2008 R2

Last week I installed System Center Operations Manager (OpsMgr) 2007 R2 on SQL Server 2008 R2. This is supported by Microsoft, but the OpsMgr wizard does not recognize a SQL Server 2008 R2 installation. Therefore a specific installation order is needed to have it all functional. All steps needed will be explained in this blogpost. Just follow them for having a correct installation.

I won't describe the SQL 2008 R2 installation here, so make sure it's ready before installation. First choose "Check Prerequisites" on the OpsMgr server. The following Roles and Role Services must be added:
  • Application Server
  • Web Server (IIS)
    • Common HTTP Features (Static Content, Default Document, Directory Browsing, HTTP Errors)
    • Application Development (ASP.NET, .NET Extensibility, ISAPI Extensions, ISAPI Filters)
    • Health and Diagnostics (HTTP Logging, Request Monitor)
    • Security (Windows Authentication, Request Filtering)
    • Performance (Static Content Compression)
    • Management Tools (IIS Management Console, IIS 6 Metabase Compatibility, IIS 6 WMI Compatibility)
The "Microsoft ASP.NET 2.0 AJAX Extensions 1.0" is needed here also. When Prerequisites looks fine the installation can be continued. There are 2 service accounts needed for OpsMgr functionality (Administrator and Action account).

Normally the installation starts with "Install Operations Manager 2007 R2" for installing the databases. This because the specific order which must be followed during installation:
  1. OperationsManager database component (SQL Server)
  2. OperationsManager Data Warehouse component (SQL Server)
  3. OperationsManager Management Server and console components (OpsMgr Server)
  4. OperationsManager Reporting component (SQL Server)
Now another utility is used for creating the database and Data Warehouse components. It's called DBCreateWizard.exe which is found in the <OpsMgr source>\SupportTools\AMD64 folder. Use it twice for creating both databases and decide the name and size in it.

Then Operations Manager can be installed on the OpsMgr server with the default GUI. Just start with "Install Operations Manager 2007 R2" again and select all components except "Database". Follow all necessary steps during setup for a complete installation. There is the possibility to install it on another location or drive here.

Again a different approach is needed now. Before the Reporting component can be installed a workaround is needed. Otherwise it won't be functional. Have a look at local groups on the SQL Server and rename “SQLServerReportServerUser$<OpsMgr Server>$MSRS10_50.MSSQLSERVER” to “SQLServerReportServerUser$<OpsMgr Server>$MSRS10.MSSQLSERVER”.
 
Now the Reporting component can be installed with the default GUI. Just start with "Install Operations Manager 2007 R2 Reporting" and select the "Reporting Server" component only. No Data Warehouse installation is needed on SQL Server 2008 R2. Follow all necessary steps during setup for the installation. Again there is the possibility to install it on another location or drive.

All components are installed now, but the local group must be changed again. Rename the local group to “SQLServerReportServerUser$<OpsMgr Server>$MSRS10_50.MSSQLSERVER” back again. After that Operations Manager is installed and usable. The Reporting component is even functional then.

To install latest hotfixes CU3 is needed. It can be download here: http://www.microsoft.com/download/en/details.aspx?id=17893
All steps needed for a functional installation are explained now. Hope you like it and use these steps for instaling OpsMgr 2007 R2 yourself!